Netflix Performance Dashboard: Analyzing Movies and Shows
Problem Statement:
- The main goal was to create a performance dashboard to evaluate and analyze the success of Netflix movies and shows.
- Key performa
- Ratings (user ratings and average ratings).
- Genre Popularity (how different genres perform on Netflix).
- Release Patterns (impact of release date on viewership).
- Lead Actors and Directors (relationship between cast/crew and performance).
- Country-specific Performance (regional preferences and success).
Project Objectives:
- To help Netflix’s content and marketing teams understand the factors that contribute to a movie/show’s success.
- To identify trends, such as the most popular genres or the impact of specific actors/directors on ratings and viewership.
- To allow stakeholders to explore data and make informed decisions for future content creation and marketing.
Tools & Technologies Used:
- Python: Used for data cleaning, handling missing values, and preprocessing the data.
- Libraries like Pandas and NumPy were utilized for data manipulation and preparation.
- Power BI: Used to create an interactive, visually appealing dashboard with:
- Various charts (bar, line, pie, heatmaps) for visualizing Netflix performance metrics.
- Custom interactive filters for users to drill down into specific data points (e.g., genre, region, or director).
- DAX Functions in Power BI: Used to create calculated measures for:
- Top Actors (e.g., identifying which actors are associated with the most successful movies/shows).
- Top Directors (assessing the impact of directors on content performance).
- Top Genres (analyzing genre popularity based on user ratings and views).
Data Cleaning & Preprocessing:
- Handling Null Values:
- Applied appropriate techniques to handle missing or null values. For example, used forward filling, mean imputation, or removed rows based on the criticality of the missing data.
- Data Standardization:
- Ensured consistency across categorical variables such as genre, country, and director names.
- Duplicate Removal:
- Identified and removed duplicate entries to ensure the dataset’s integrity.
- Data Transformation:
- Categorical variables were encoded, and numerical features were normalized or standardized as necessary to prepare the data for analysis.


DAX Functions for Calculated Measures:
- Top Actors Measure:
- Created DAX measures to calculate the top-performing actors by aggregating ratings and viewership.
- Top Directors Measure:
- Used DAX to measure director performance based on the success of the content they directed (viewership, ratings).
- Top Genres Measure:
- Created measures to identify which genres are performing best on Netflix by aggregating ratings and views across genres.


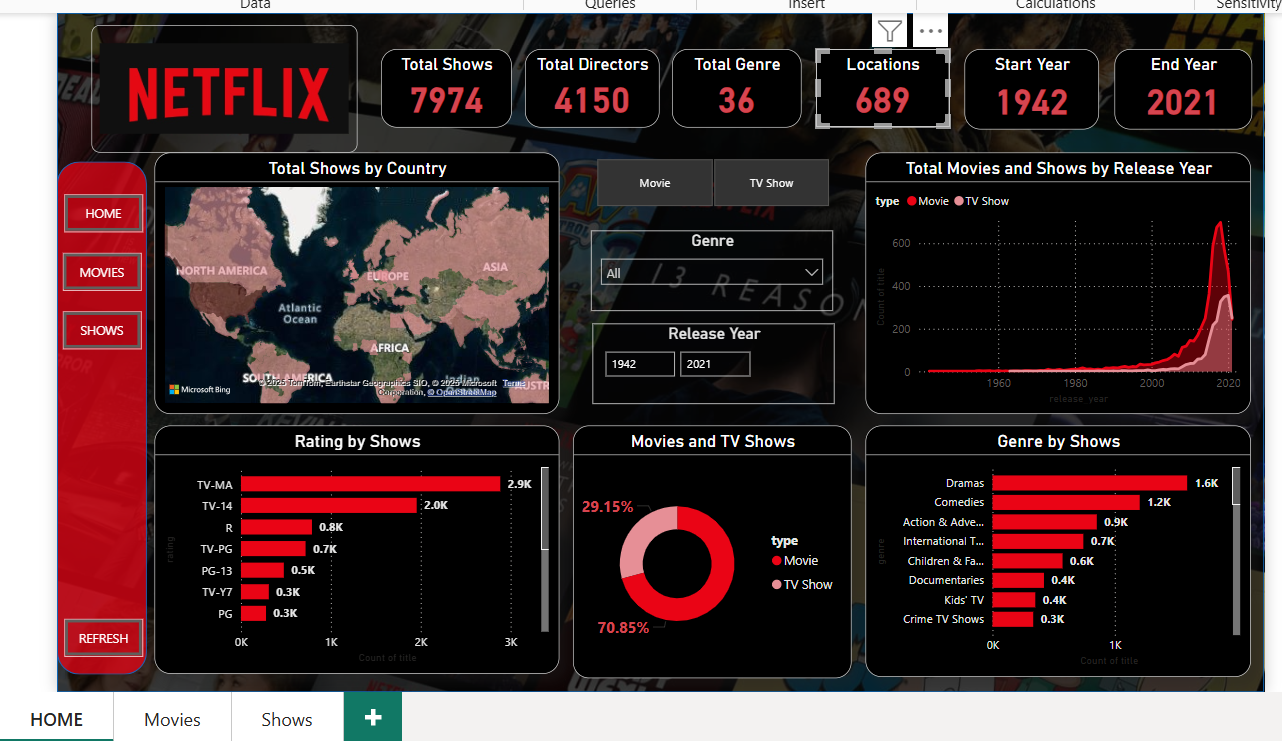
Dashboard Features & Visualizations:
- Ratings Analysis:
- A bar chart showing average ratings across different genres or regions.
- Genre Popularity:
- Pie charts illustrating the distribution of genres based on viewer ratings and views.
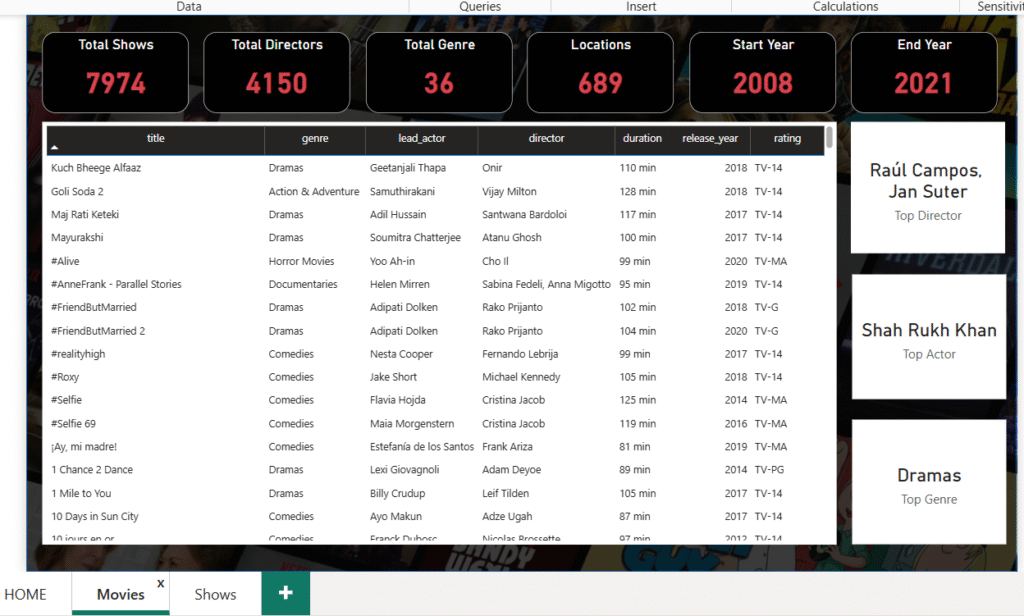
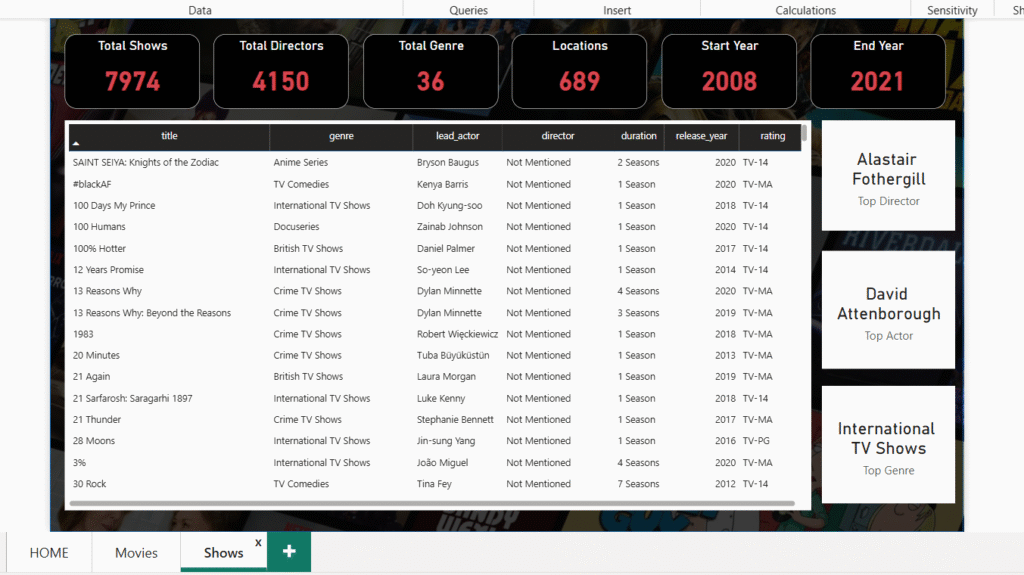
- Top Actors & Directors:
- Calculated measures using DAX to identify the top actors and directors based on average ratings and viewership.
- Bar charts highlighting the actors and directors who contributed to successful movies and shows.
- Release Patterns:
- Line charts showing the correlation between the release date and performance (viewership spikes, seasonal patterns).
- Country-specific Insights:
- Heatmaps and bar charts visualizing Netflix’s performance in different countries, helping to understand regional preferences.


Key Insights & Findings:
- Genre Preferences:
- Identified the most successful genres based on ratings and views (e.g., drama, action, comedy).
- Actor/Director Impact:
- Found that certain actors or directors consistently contributed to higher ratings or more successful content.
- Release Timing:
- Discovered patterns showing that content released during specific months or seasons saw more viewership, helping to identify optimal release windows.
- Regional Performance:
- Revealed which countries have distinct content preferences, such as particular genres or actor choices.
Challenges Faced:
- Handling Large Datasets:
- Working with a massive volume of data, requiring careful optimization for speed and performance.
- Data Quality:
- Managing incomplete data from multiple sources and ensuring consistency in ratings, genre names, and country codes.
- Complex Calculations in DAX:
- Developing the correct DAX measures for top actors, directors, and genres required a deep understanding of data relationships.
Impact of the Project:
- The dashboard provided actionable insights for Netflix’s content team, marketing team, and decision-makers by enabling them to assess content performance in real time.
- It helped Netflix optimize content strategy by identifying top-performing content types and guiding future content creation based on successful patterns.
Future Enhancements:
- Predictive Analysis:
- Implementing machine learning models to predict the future performance of upcoming content based on past trends.
- Sentiment Analysis:
- Analyzing user reviews with NLP to gain deeper insights into viewer sentiment.
- Viewer Retention Analysis:
- Adding features to track how long viewers stay engaged with content and identifying patterns related to viewer retention.