Data Analysis Sales Dashboard
Business Requirements & User Stories :
The business Request for this project was an executive sales report for Sales Manager. Based on the request that was made by the business, the following user stories were defined to fulfill the delivery and ensure that acceptance criteria were maintained throughout the project
| No # | As a (role) | I want (request / demand) | So that I (user value) | Acceptance Criteria |
| 1 | Sales Manager | To get a dashboard overview of internet sales | Can follow better which customers and products sells the best | A Power BI dashboard which updates data once a day |
| 2 | Sales Representative | A detailed overview of Internet Sales per Customers | Can follow up my customers that buys the most and who we can sell more to | A Power BI dashboard which allows me to filter data for each customer |
| 3 | Sales Representative | A detailed overview of Internet Sales per Products | Can follow up my Products that sells the most | A Power BI dashboard which allows me to filter data for each Product |
| 4 | Sales Manager | A dashboard overview of internet sales | Follow sales over time against budget | A Power BI dashboard with graphs and KPIs comparing against budget. |
Data Cleaning and Transformation(SQL)
To create the necessary data model for doing analysis and fulfilling the business needs defined in the user stories the tables were created in SQL (Below).
One extra data source- SalesBudget was provided in the excel file.
Dim Date Cleaned


Dim Customer Cleaned


Dim Product Cleaned


FactInternetSales Cleaned


Data Tables

Data Model

Created Measures:

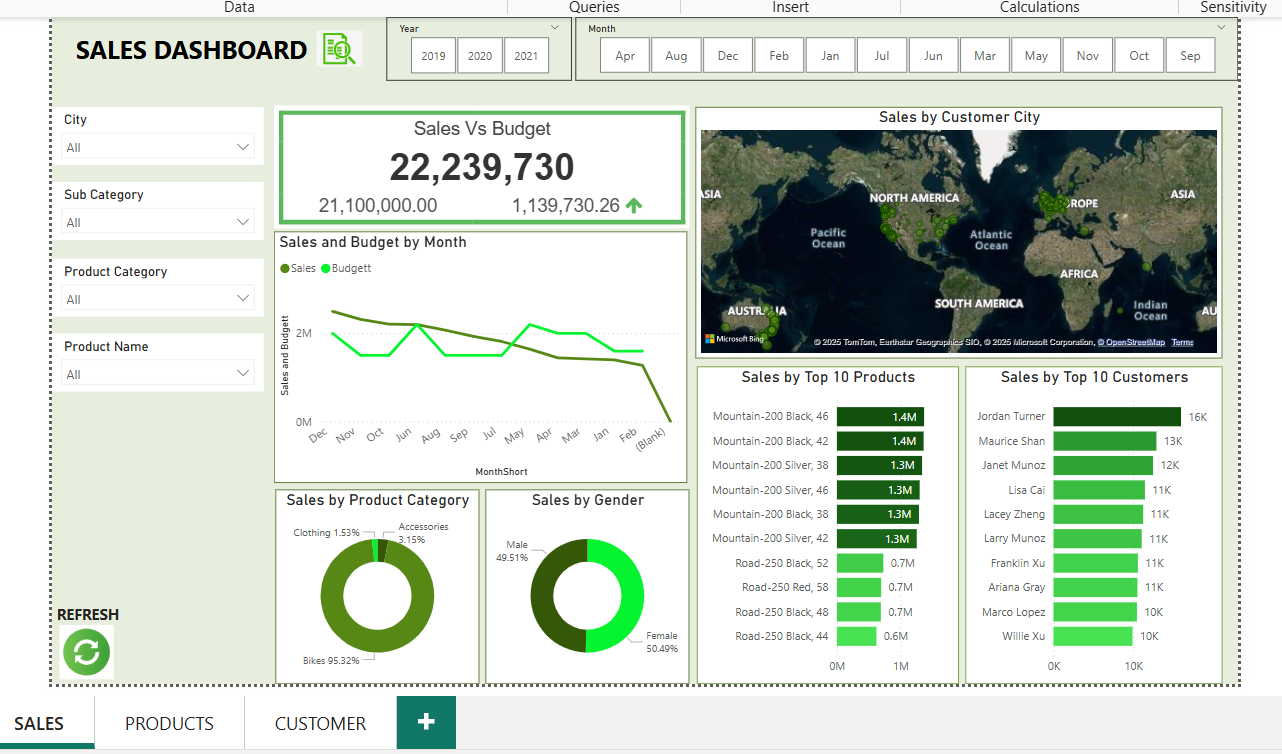
Data Visualization
The dashboard has been prepared using various filters, card visuals, bar charts, pie charts, and maps for showcasing locations


Sales Dashboard: Key Performance Indicators (KPIs)
- Sales vs. Budget:
- KPI Definition: Compares actual sales performance to the budgeted sales targets.
- Purpose: To track how well the company is performing in relation to set sales targets and identify any deviations.
2. Sales by City:
- KPI Definition: Breakdown of sales by different geographic locations (cities).
- Purpose: To identify high-performing cities and areas that may need more focus or resources.
3. Sales by Product Category:
- KPI Definition: Tracks sales performance across different product categories.
- Purpose: To assess which product categories are driving the most revenue and help with inventory or marketing decisions.
- Sales by Gender:
KPI Definition: Analyzes sales based on customer gender.
Visualization: Bar Chart to compare sales for male and female customers.
Pie Chart to see the overall share of sales by gender.
Purpose: To understand demographic trends and adjust marketing or product offerings to better serve customer preferences.
2. Sales by Top 10 Products:
- KPI Definition: Identifies the top 10 best-selling products.
- Visualization:
- Bar Chart displaying the sales of the top 10 products.
- Line Chart showing trends in top-selling products over time.
- Purpose: To focus on the most popular products and understand which items are driving sales.
3. Sales by Top 10 Customers:
- KPI Definition: Tracks the top 10 customers contributing to sales.
- Visualization:
- Bar Chart for a comparison of sales generated by the top 10 customers.
- Pie Chart to see the proportion of total sales attributed to each customer.
- Purpose: To identify high-value customers, enabling personalized strategies for retention and loyalty.
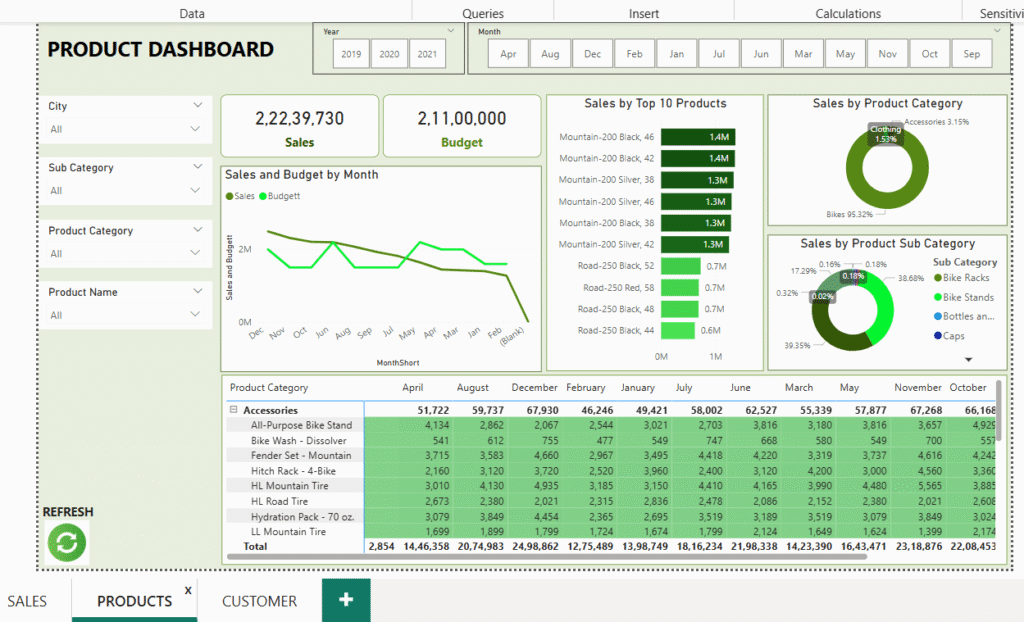
4. Sales by Product (Detailed View):
- KPI Definition: Provides sales data for individual products.
- Purpose: To track the performance of individual products and adjust inventory or marketing efforts accordingly.
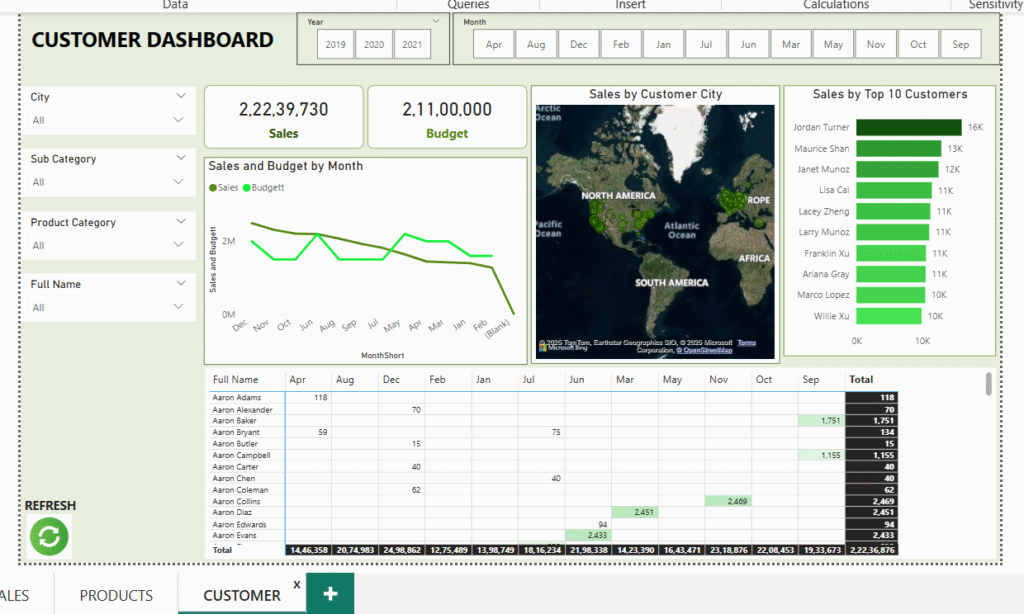
5. Sales by Customer (Detailed View):
- KPI Definition: Provides a detailed breakdown of sales by individual customers.
- Purpose: To understand customer purchasing behavior and focus on high-value clients for future sales initiatives..
Purpose of the Dashboard:
- To provide stakeholders with actionable insights on sales performance across various dimensions (product, geography, gender, customer).
- To monitor sales performance and make data-driven decisions for optimizing sales strategies and identifying growth opportunities.
- The dashboard empowers decision-makers with interactive tools to explore data in-depth and filter it based on specific KPIs.