A KPI-Driven Study of Lowell General Hospital
Business Context :
Lowell General Hospital places patient well-being at the core of its care delivery model. While maintaining a strong reputation for quality and safety, hospital leadership recognizes that patient dissatisfaction can arise from multiple operational and clinical factors.
To ensure patients continue to receive safe, responsive, and high-quality care, management initiated a data-driven analysis of key healthcare performance and patient safety metrics to better understand their impact on patient experience.
Problem Statement :
Despite a strong commitment to patient-centric care, variations in hospital operations and safety outcomes may influence patient satisfaction.
A structured analysis of critical KPIs is required to:
Identify performance trends
Evaluate relationships between operational efficiency, staff responsiveness, and patient safety
Detect potential areas of risk impacting patient experience
Project Objectives :
- Assess the impact of key healthcare KPIs on patient experience and safety
- Analyze correlations between operational and safety metrics
- Benchmark hospital performance against defined standards
- Provide data-driven recommendations to enhance patient satisfaction and care quality
Key Metrics Analyzed :
- Average Licensed Bed Occupancy Rate
- Staff Responsiveness – Top Box Score
- Unassisted Fall Rate per 1,000 Patient Days
Dataset Overview :
Data Source
Lowell General Hospital – Healthcare Performance Dataset
- Dataset Scope
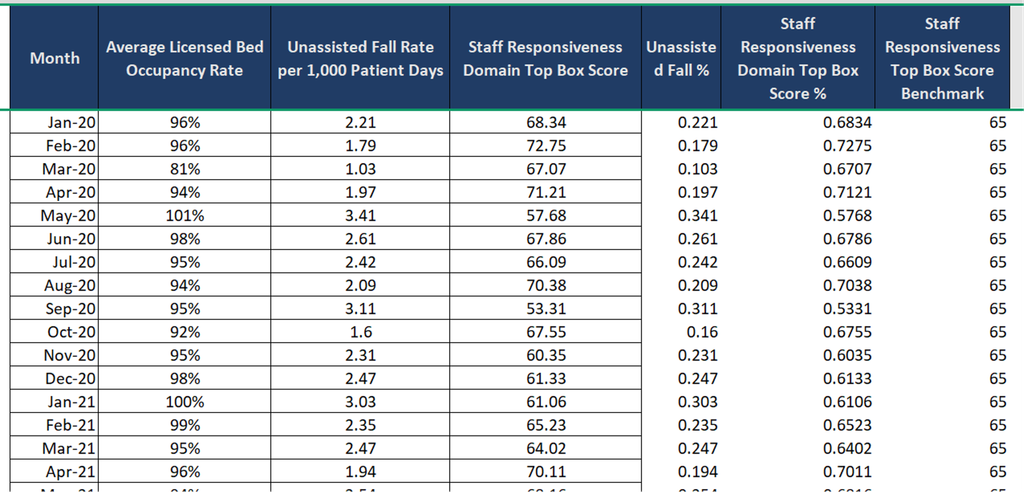
- Records: 60 rows × 4 columns
- Granularity: Monthly data
- Timeframe: January 2020 – December 2024
- Coverage: 5 years of hospital performance data
Key Variables Analyzed
- Month
- Average Licensed Bed Occupancy Rate
- Unassisted Fall Rate per 1,000 Patient Days
- Staff Responsiveness – Domain Top Box Score
Dataset preview :
Understanding KPIs :
1. Average Licensed Bed Occupancy Rate :
Purpose: Measures hospital capacity utilization and operational efficiency
Captured internally and reported as a percentage
Indicates how effectively licensed beds are being utilized over time
High occupancy may impact staff workload and patient experience
Calculation:

2. Staff Responsiveness –Top Box Score
Purpose: Measures patient perception of staff responsiveness and quality of care
Derived from the Hospital Consumer Assessment of Healthcare Providers and Systems (HCAHPS) survey
Collected post-discharge from patients
Based on responses to two key questions:
Timeliness of help after pressing the call button
Timeliness of assistance with bathroom use or bedpan
Top Box Definition:
Percentage of patients who responded “Always” to both questions
Calculation:

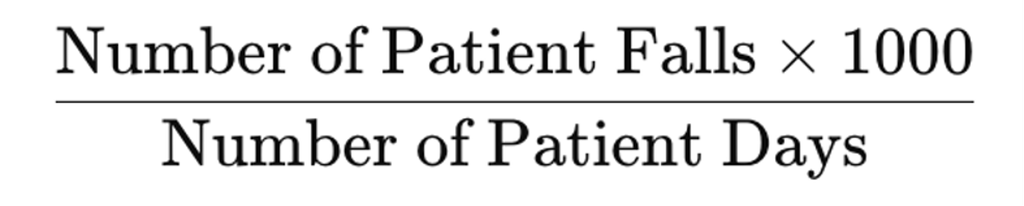
3. Unassisted Patient Falls per 1,000 Patient Days
Purpose: Measures patient safety and fall-prevention effectiveness
Sourced from the National Database of Nursing Quality Indicators (NDNQI)
A fall is defined as an unplanned descent to the floor, with or without injury
Unassisted falls occur when no staff member is present to help the patient
Calculation:
Metrics
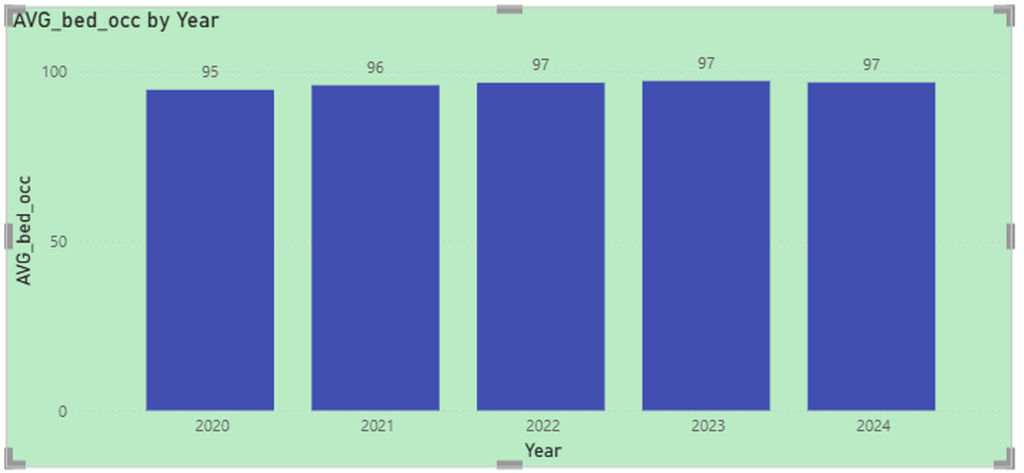
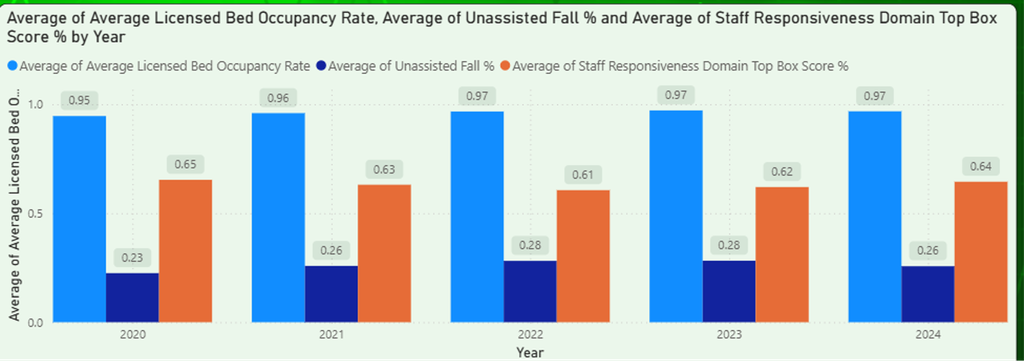
Average Licensed Bed Occupancy Rate :
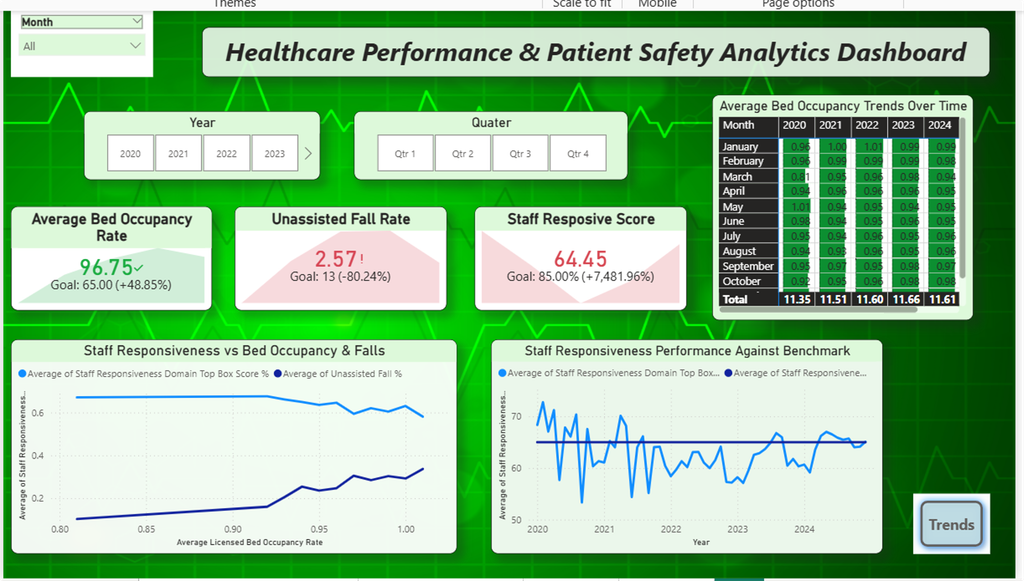
Bed occupancy levels remained consistently high throughout the period
Increased slightly from 95% in 2020 to approximately 97% from 2022 through 2024
This stability reflects strong and sustained utilization of licensed bed capacity, indicating high operational demand
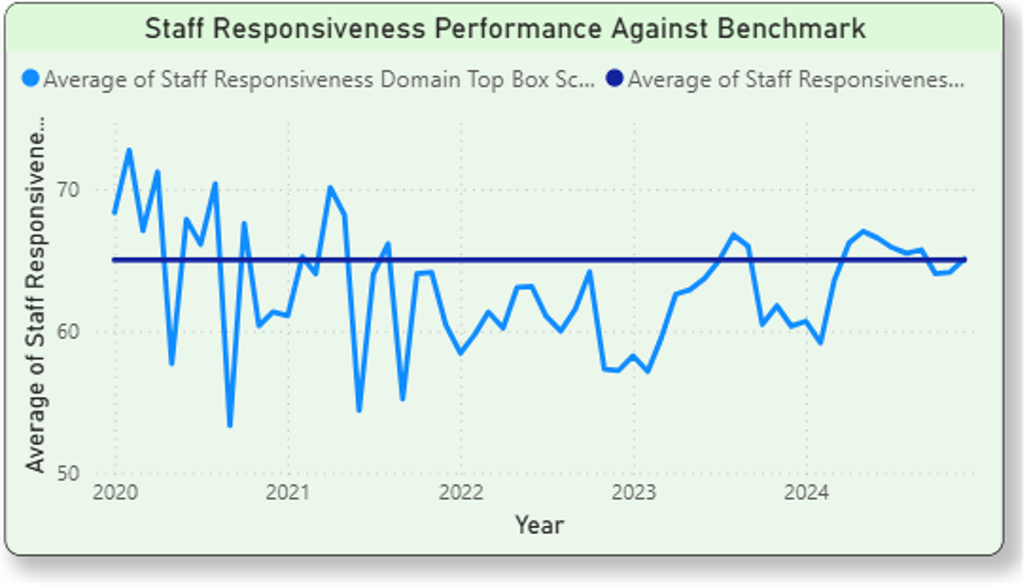
Staff Responsiveness – Top Box Score (%)
Staff responsiveness scores declined from 65% in 2020 to 61% in 2022
A gradual recovery was observed, reaching 64% by 2024
While recent improvements suggest corrective efforts are having some impact, overall responsiveness remains an area requiring continued focus
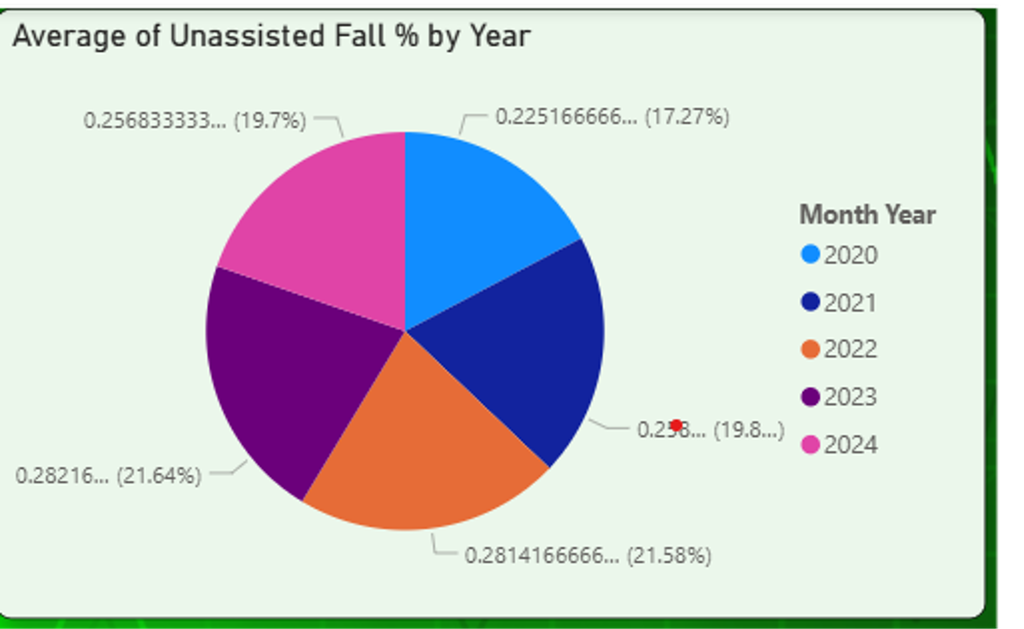
Unassisted Patient Falls (%)
The percentage of unassisted falls
increased from 23% in 2020 to 28% in
2022 and 2023
A slight reduction to 26% was observed
in 2024
This pattern indicates ongoing patient
safety risks, highlighting the need
for strengthened fall-prevention
strategies.
Relationship Between KPIs :
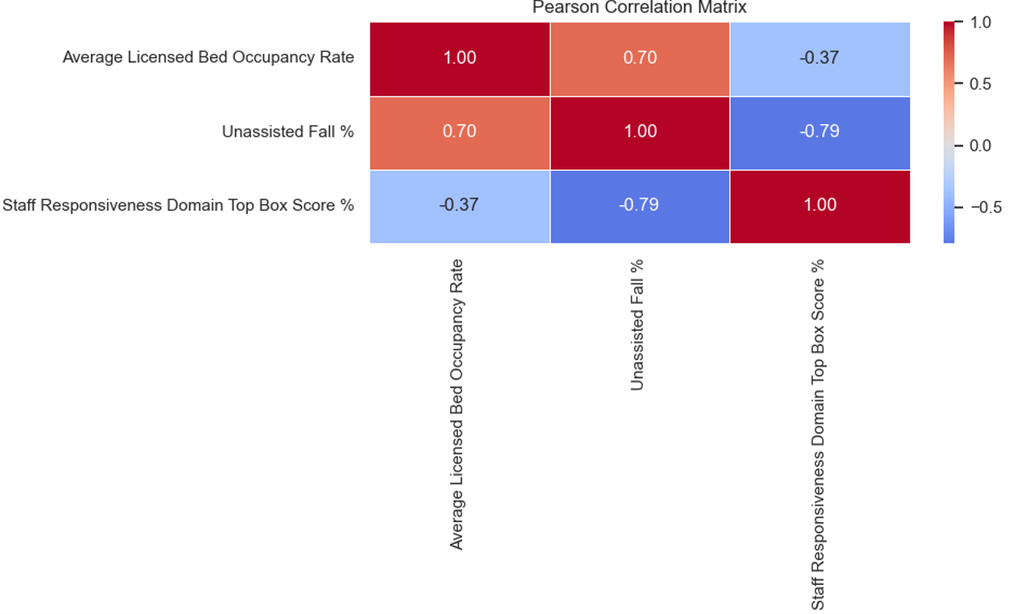
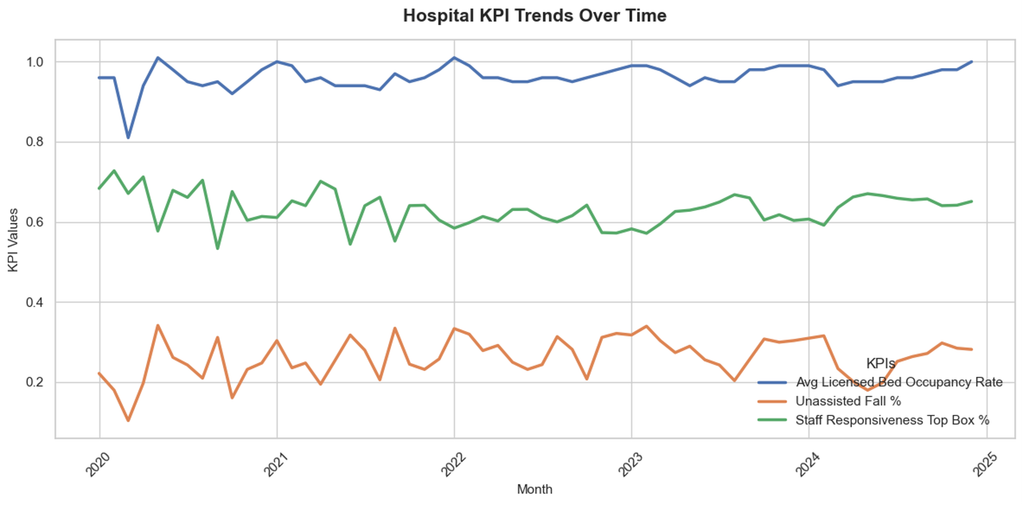
Correlation Analysis Summary
- Bed Occupancy Rate vs. Unassisted Fall Rate (per 1,000 Patient Days)
- Correlation: +0.70 (Strong Positive Relationship)
- Higher bed occupancy levels are associated with an increase in unassisted patient falls, suggesting potential strain on staff capacity during periods of high utilization.
- Bed Occupancy Rate vs. Staff Responsiveness – Top Box Score
- Correlation: −0.37 (Moderate Negative Relationship)
- As bed occupancy increases, staff responsiveness scores tend to decline, indicating possible operational pressure impacting timely patient assistance.
- Unassisted Fall Rate (per 1,000 Patient Days) vs. Staff Responsiveness – Top Box Score
- Correlation: −0.79 (Strong Negative Relationship)
- Lower staff responsiveness is strongly associated with higher unassisted fall rates, highlighting staff responsiveness as a critical driver of patient safety outcomes.
- 💡 Key Insight
- High bed occupancy may indirectly affect patient safety by reducing staff responsiveness, leading to increased unassisted falls.
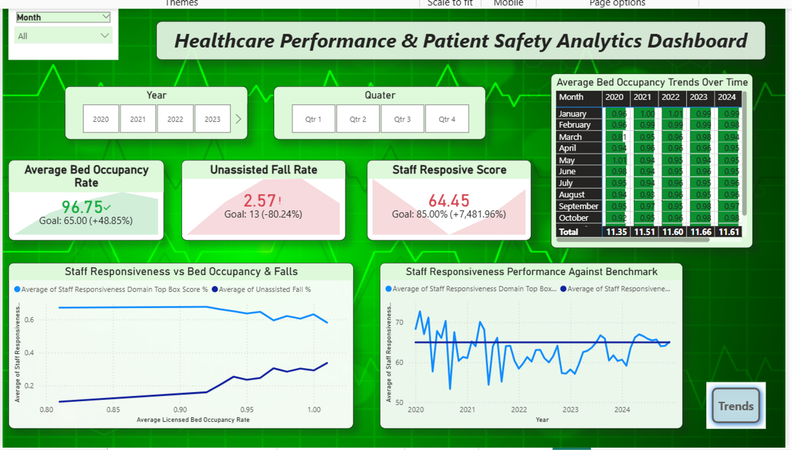
Visualization using PowerBi :
Tools & Technology Used
- Python: Pandas, NumPy
- Visualization: Matplotlib, Seaborn &
- Power Bi – Dashboarding
- Analysis: Pearson correlation for linear relationships,
- Spearman correlation for monotonic relationships
- Environment: Jupyter Notebook
Summary of Insights & Findings :
- Analysis of key KPIs at Lowell General Hospital highlights strong interdependencies between bed occupancy, staff responsiveness, and patient safety. A strong positive correlation (r = +0.70) indicates that higher bed occupancy is associated with increased unassisted fall rates, suggesting operational strain during high-demand periods.
- Bed occupancy also shows a moderate negative relationship with staff responsiveness (r = −0.37), implying that rising patient volumes may impact staff availability.
- Staff responsiveness demonstrates a strong negative correlation with unassisted falls (r = −0.79), confirming its critical role in patient safety outcomes.
- Findings show consistently high bed occupancy, responsiveness challenges during peak periods, and increased fall rates with higher occupancy.
Key Recommendations :
Optimized Staff-to-Patient Ratios –
- Maintaining an appropriate staff-to-patient ratio is essential to prevent staff overload, ensure timely patient assistance, and reduce the likelihood of unassisted falls—particularly during periods of high bed occupancy.
Targeted Staff Training & Responsiveness Enhancement –
- Focused training programs aimed at improving staff alertness, responsiveness, and proactive patient monitoring—especially during peak occupancy periods—can significantly enhance patient safety and lower fall risks.
Adaptive Operational Planning –
- Staffing levels should be reviewed and adjusted dynamically based on real-time bed occupancy trends to maintain consistent care quality, reduce operational strain, and support patient safety across all demand levels.
Conclusion :
Sustaining optimal bed occupancy levels, supported by responsive and well-trained staff, is critical to improving patient safety and overall hospital performance. Long-term success relies on continuous optimization of staffing strategies, ongoing training initiatives, and proactive operational planning aligned with patient demand.