Latest posts
-
Healthcare Performance & Patient Safety Analytics
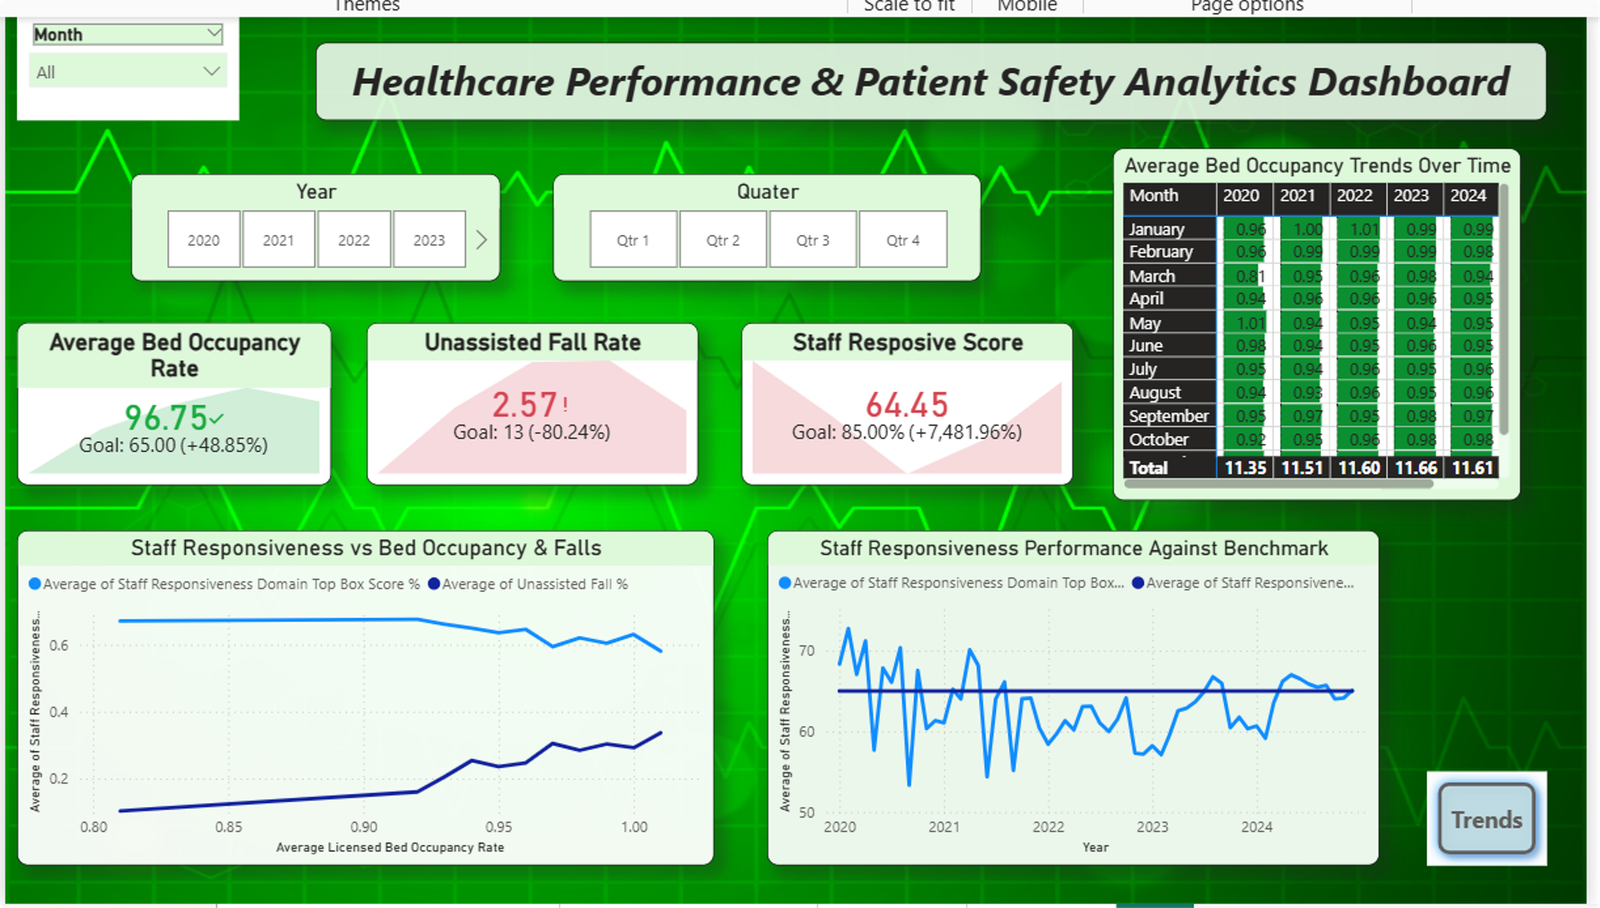
A KPI-Driven Study of Lowell General Hospital Business Context : Lowell General Hospital places patient well-being at the core of its care delivery model. While maintaining a strong reputation for quality and safety, hospital leadership recognizes that patient dissatisfaction can arise from multiple operational and clinical factors.To ensure patients continue to receive safe, responsive, and…
-
Customer Segmentation Using RFM Analysis in E-Commerce

Business Problem: E-commerce companies collect large volumes of transactional data but often lack a structured approach to convert it into meaningful customer insights. Without proper segmentation, marketing efforts become generic, leading to lower retention and higher churn. Project Objectives: Dataset Overview : Data Cleaning & Preparation : Exploratory Insights : Pareto Principle :Roughly 80% of…
-
Netflix Performance Dashboard: Analyzing Movies and Shows

Problem Statement: Project Objectives: Tools & Technologies Used: Data Cleaning & Preprocessing: 5. DAX Functions for Calculated Measures: 6. Dashboard Features & Visualizations: 7. Key Insights & Findings: 8. Challenges Faced: 9. Impact of the Project: 10. Future Enhancements:
-
Data Analysis Sales Dashboard
Business Requirements & User Stories The business Request for this project was an executive sales report for Sales Manager. Based on the request that was made by the business, the following user stories were defined to fulfill the delivery and ensure that acceptance criteria were maintained throughout the project No # As a (role) I…
-
Food Delivery App Performance Dashboard

Problem Statement: Approach: Step-wise Approach: 2. Data Cleaning: 3. Data Modeling: 4. Measure Creation: 5. Visualization & Reporting: Key Performance Indicators (KPIs): User Performance KPIs: City-wise Performance KPIs: Key Insights and Outcome: This project demonstrates the ability to clean, model, and visualize data effectively using Power BI while providing valuable insights for improving business performance.