Customer Segmentation Using RFM Analysis in E-Commerce
Driving Customer Value, Retention, and Targeted Marketing Through Data

Business Problem :
E-commerce companies collect large volumes of transactional data but often lack a structured approach to convert it into meaningful customer insights. Without proper segmentation, marketing efforts become generic, leading to lower retention and higher churn.
Project Objectives :
•Segment customers using the RFM (Recency, Frequency, Monetary) framework
•Identify high-value, loyal, at-risk, and dormant customers
•Enable data-driven marketing and retention strategies
•Support business decisions with actionable insights
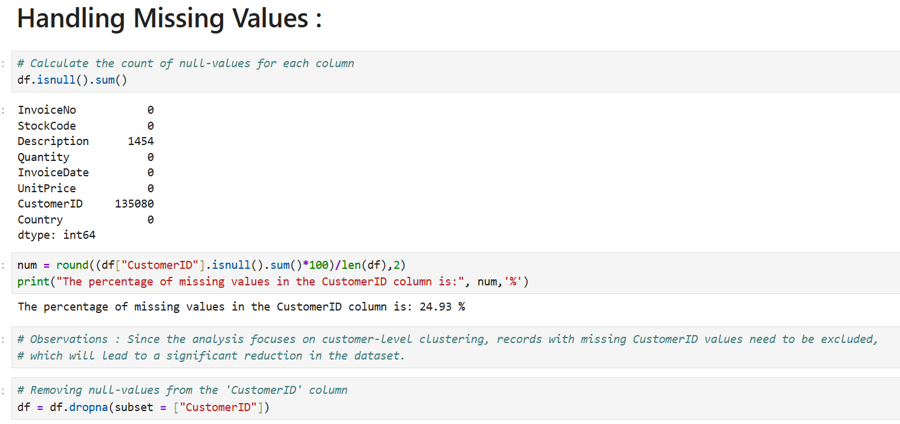
Data Cleaning & Preparation –
•Key Cleaning Steps:
•Removed 24.93% records with missing CustomerID
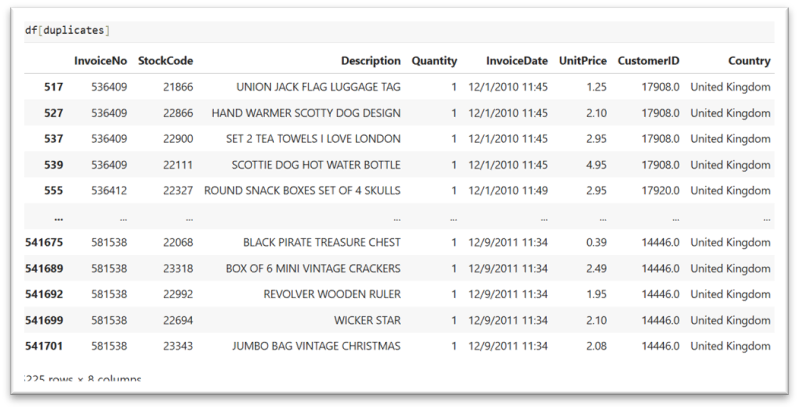
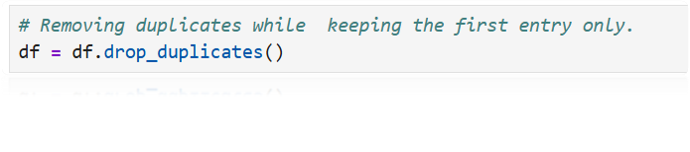
•Key Cleaning Steps:
•Eliminated 5,525 duplicate rows
•Key Cleaning Steps:
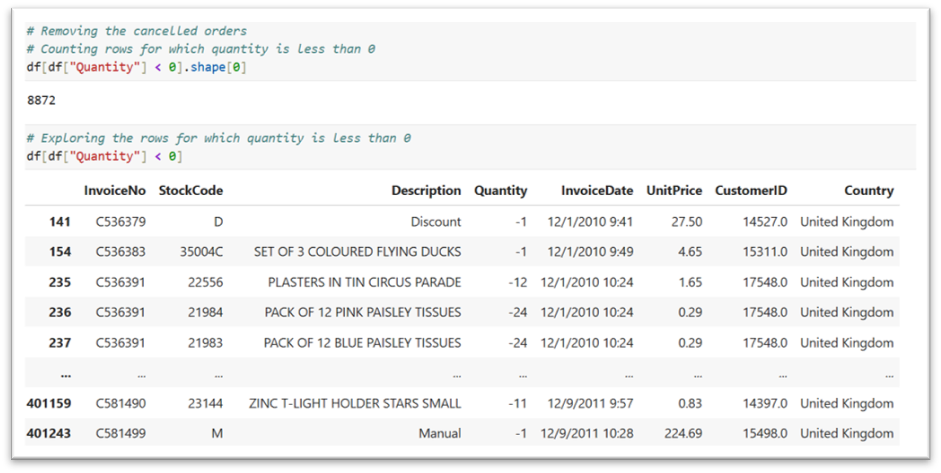
•Filtered out 8,872 cancelled transactions
•Key Cleaning Steps:
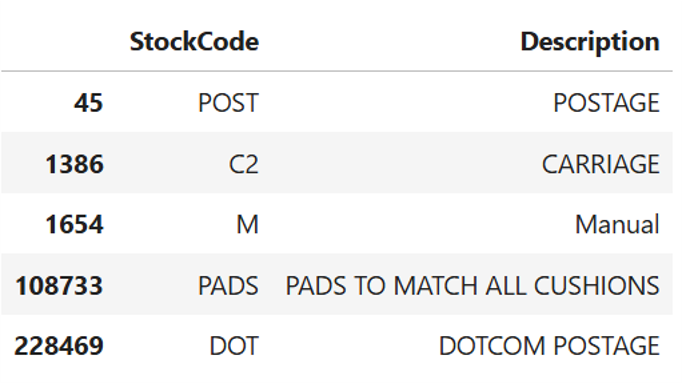
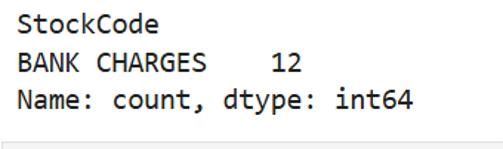
•Excluded non-product StockCodes (charges, fees)
•✔ Ensured data consistency and reliability for customer-level analysis
Exploratory Insights :
Pareto Principle :
Roughly 80% of outcomes stem from 20% of causes

•26% of customers generate ~80% of revenue (Pareto principle)
•21% of products contribute ~80% of sales
•Majority of orders are low-value, with a small group driving high revenue
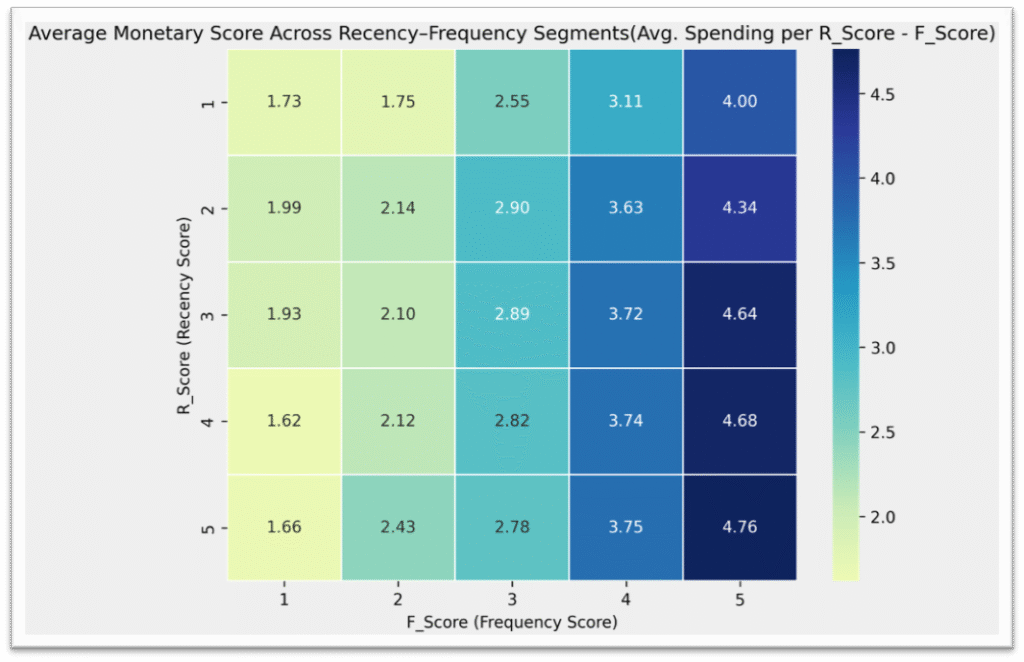
RFM Methodology :
•RFM Metrics Defined:
•Recency: Days since last purchase
•Frequency: Number of purchases
•Monetary: Total customer spend
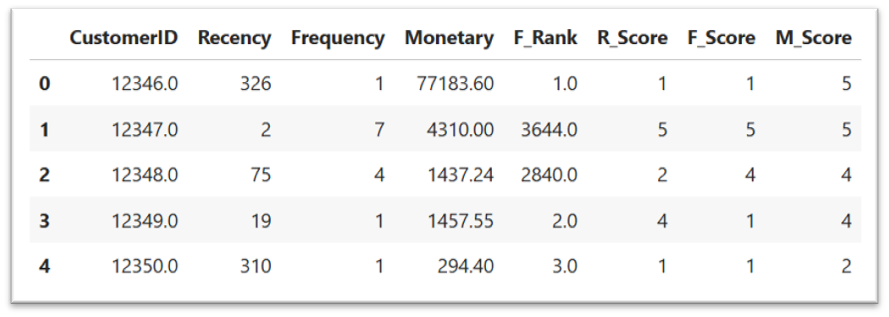
•Customers were ranked into 5 quantiles per metric and assigned scores from 1–5.
The combined score was used for segmentation.
Customer Segmentation :
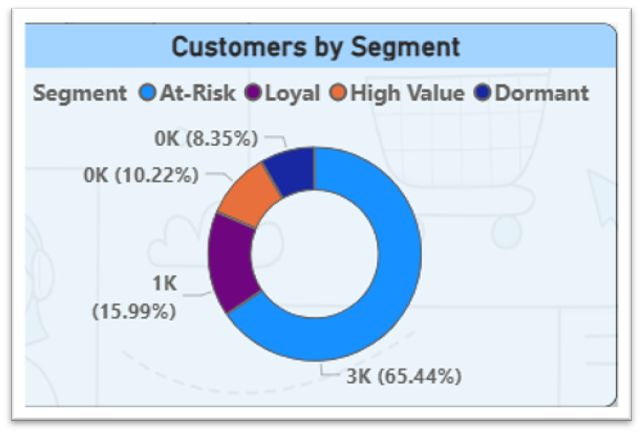
•Customer Segments Identified:
•High-Value Customers: Recent, frequent, high spenders
•Loyal Customers: Consistent purchasers with strong monetary value
•At-Risk Customers: Declining engagement
•Dormant Customers: High inactivity and churn risk
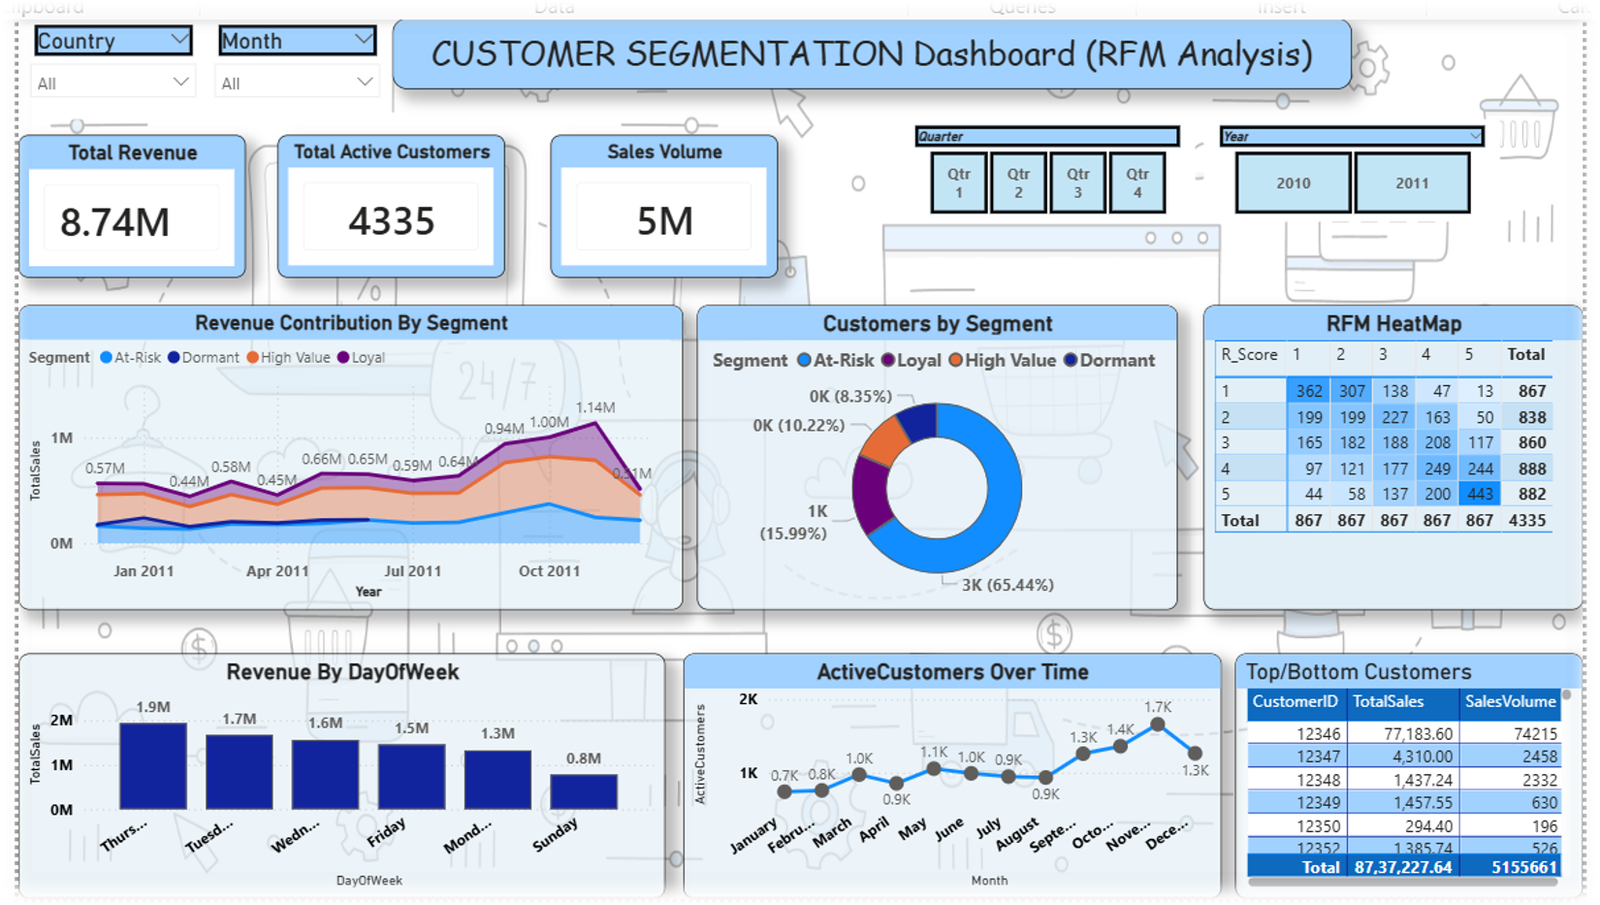
•📊 Visualized using RFM heatmaps and dashboards.
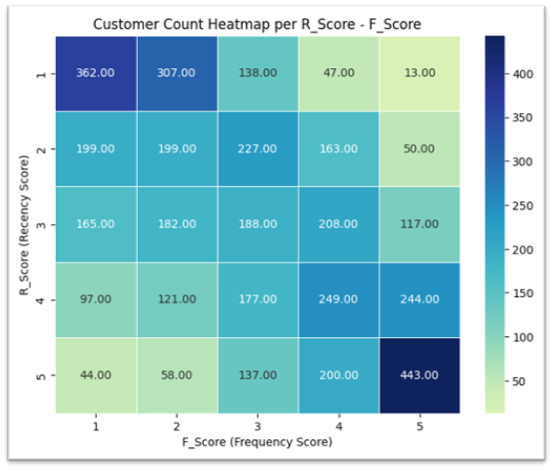
Heat Map based on RFM Score :
Customer-Level Churn Analysis :
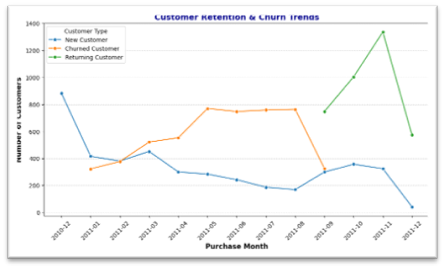
•Churned Customer:
A customer whose most recent purchase occurred more than 90 days ago.
•Methodology
•Calculated the last purchase date per customer
•Compared it with the latest date in the dataset
•Classified customers into:
•Active Customers
•Churned Customers
•Key Insight
•A significant portion of customers show extended inactivity, indicating churn risk.
•Churned customers largely overlap with low Frequency and low Monetary segments.
• (Business angle)
•Enables early churn detection
•Helps prioritize retention campaigns
•Reduces cost compared to acquiring new customers
Business Recommendations :
•Strategic Actions:
•🎯 High-Value: Loyalty programs, exclusives
•🔁 Loyal: Cross-sell & upsell campaigns
•⚠️ At-Risk: Personalized offers, limited-time discounts
•❌ Dormant: Win-back campaigns & feedback surveys
Simulated Impact of Targeted Marketing :
•Before (No Segmentation)
•Generic campaigns sent to all customers
•Low engagement and conversion rates
•Higher marketing cost with poor ROI
•After (RFM-Driven Strategy)
•Personalized campaigns by segment:
•High-Value → Loyalty rewards
•Loyal → Upsell & cross-sell
•At-Risk → Discounts & reminders
•Dormant → Win-back offers
•Simulated Outcome
•Improved engagement rates
•Increased repeat purchases
•Better marketing ROI
•Reduced churn probability
•Key Takeaway
•Targeted strategies outperform mass marketing by aligning offers with customer behavior.
VISUALIZATION IN POWER BI
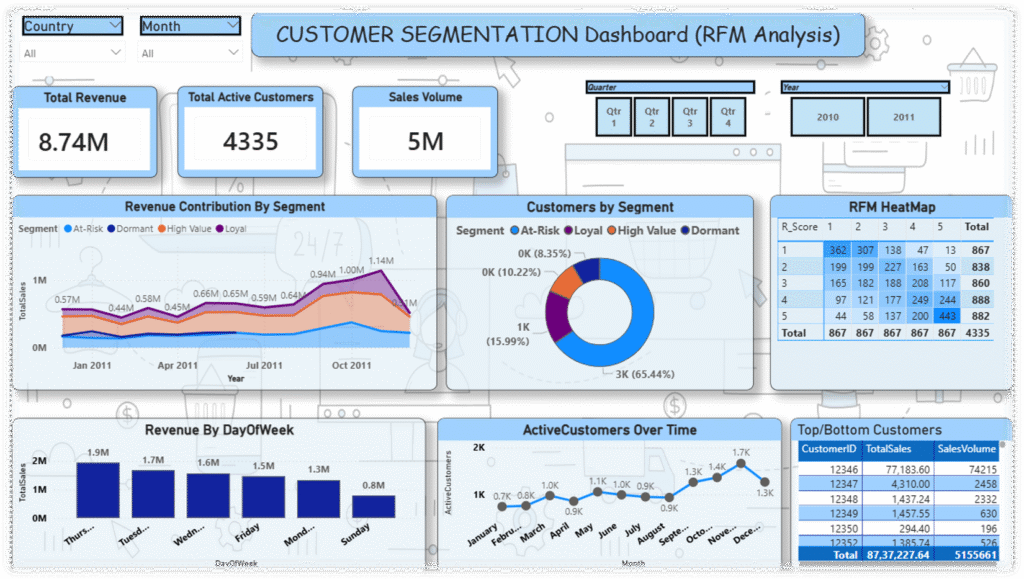
Key Outcome :
•Successfully transformed raw transactional data into actionable customer segments, enabling targeted marketing strategies, improved retention planning, and data-driven business decisions.