
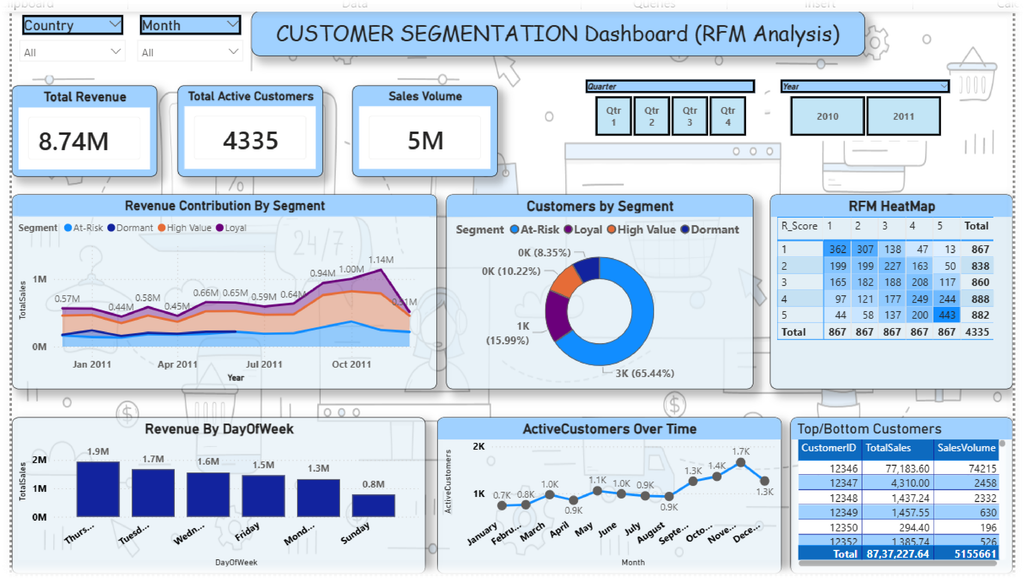
Business Problem:
E-commerce companies collect large volumes of transactional data but often lack a structured approach to convert it into meaningful customer insights. Without proper segmentation, marketing efforts become generic, leading to lower retention and higher churn.
Project Objectives:
- Segment customers using the RFM (Recency, Frequency, Monetary) framework
- Identify high-value, loyal, at-risk, and dormant customers
- Enable data-driven marketing and retention strategies
- Support business decisions with actionable insights
Dataset Overview :
- Source: Kaggle – E-commerce Dataset
- Time Period: Dec 2010 – Dec 2011
- Size: 541,909 transactions
- Key Features: InvoiceNo, CustomerID, StockCode, Quantity, InvoiceDate, UnitPrice, Country
Data Cleaning & Preparation :
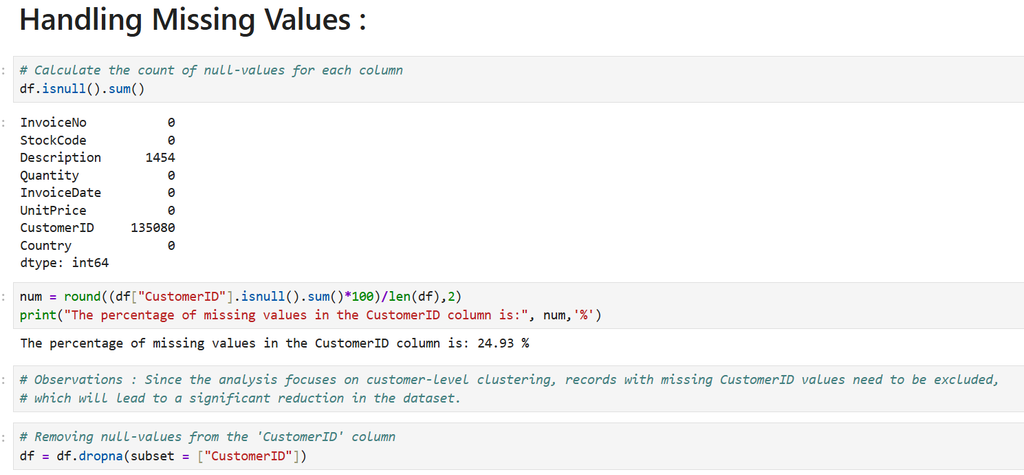
- Key Cleaning Steps:
Removed 24.93% records with missing CustomerID
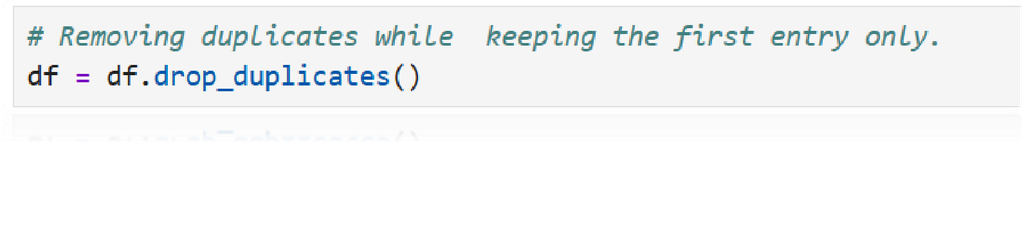
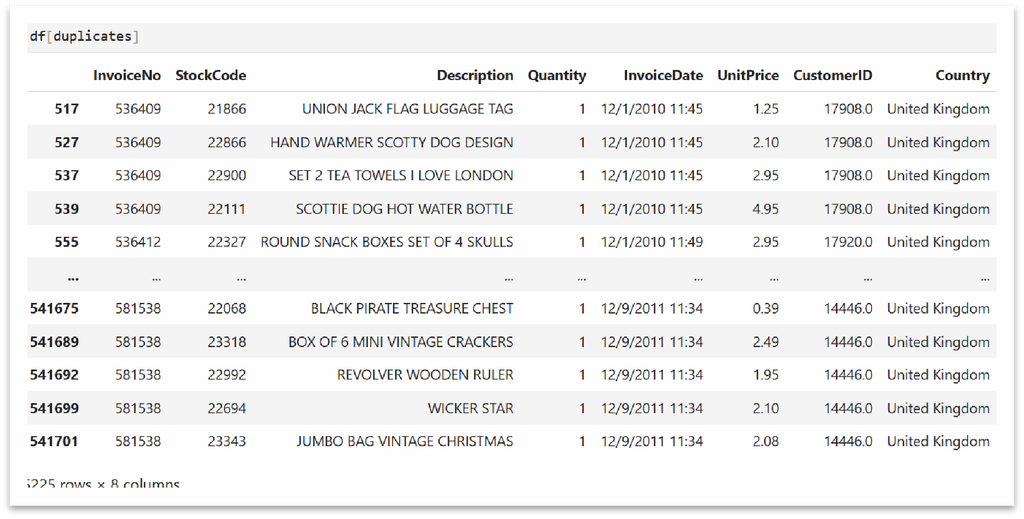
- Key Cleaning Steps:
Eliminated 5,525 duplicate rows
- Key Cleaning Steps:
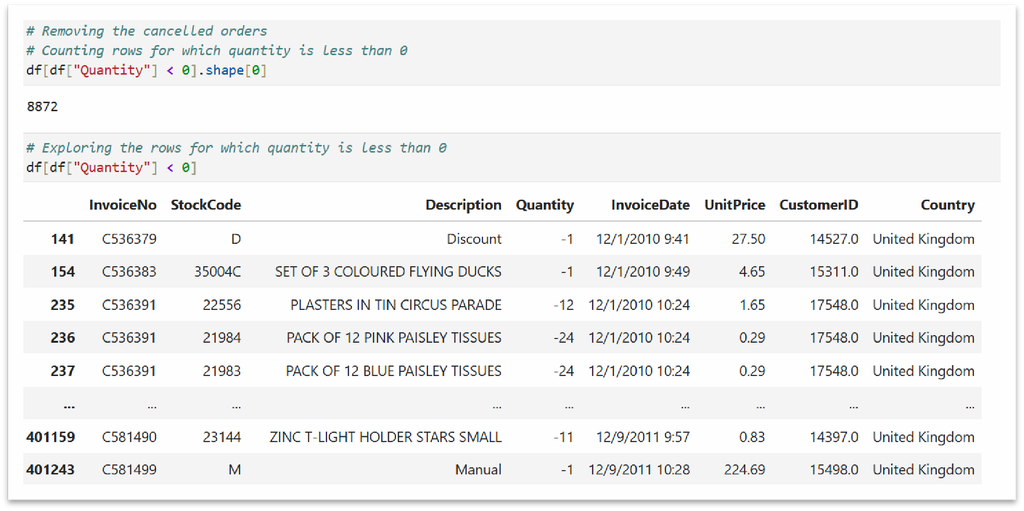
Filtered out 8,872 cancelled transactions
- Key Cleaning Steps:
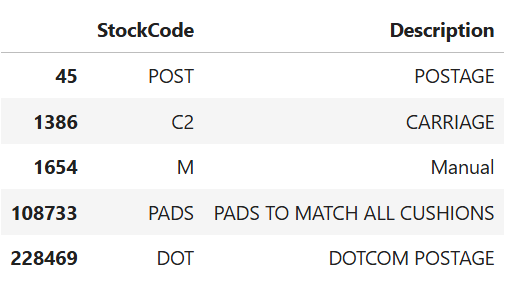
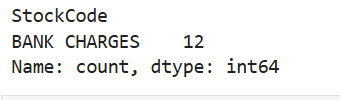
Excluded non-product StockCodes (charges, fees)
✔ Ensured data consistency and reliability for customer-level analysis
Exploratory Insights :
Pareto Principle :
Roughly 80% of outcomes stem from 20% of causes
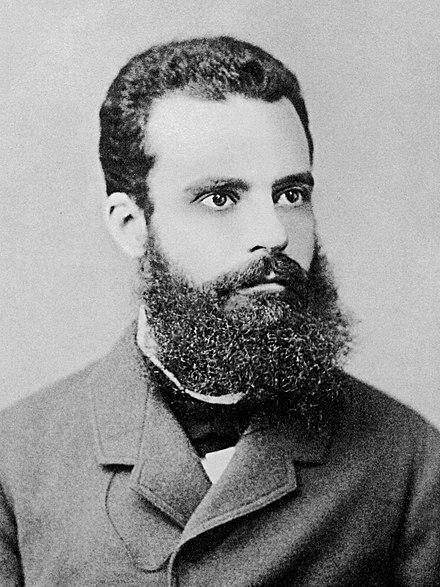
- 26% of customers generate ~80% of revenue (Pareto principle)
- 21% of products contribute ~80% of sales
- Majority of orders are low-value, with a small group driving high revenue
RFM Methodology :
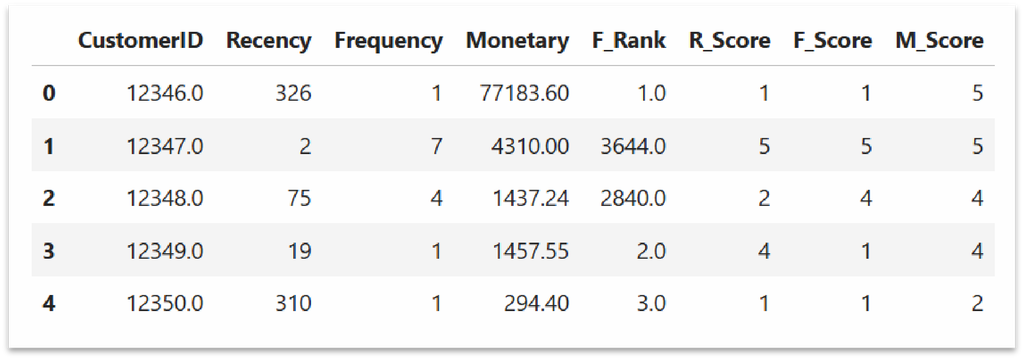
RFM Metrics Defined:
- Recency: Days since last purchase
- Frequency: Number of purchases
- Monetary: Total customer spend
- Customers were ranked into 5 quantiles per metric and assigned scores from 1–5. The combined score was used for segmentation.
Customer Segmentation :
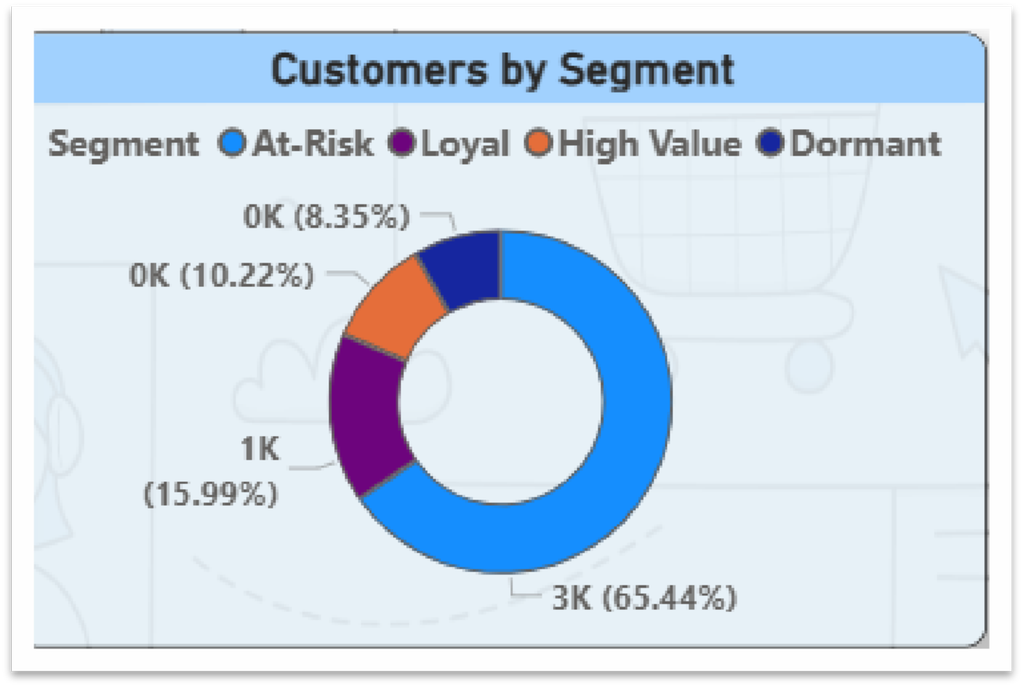
Customer Segments Identified:
- High-Value Customers: Recent, frequent, high spenders
- Loyal Customers: Consistent purchasers with strong monetary value
- At-Risk Customers: Declining engagement
- Dormant Customers: High inactivity and churn risk
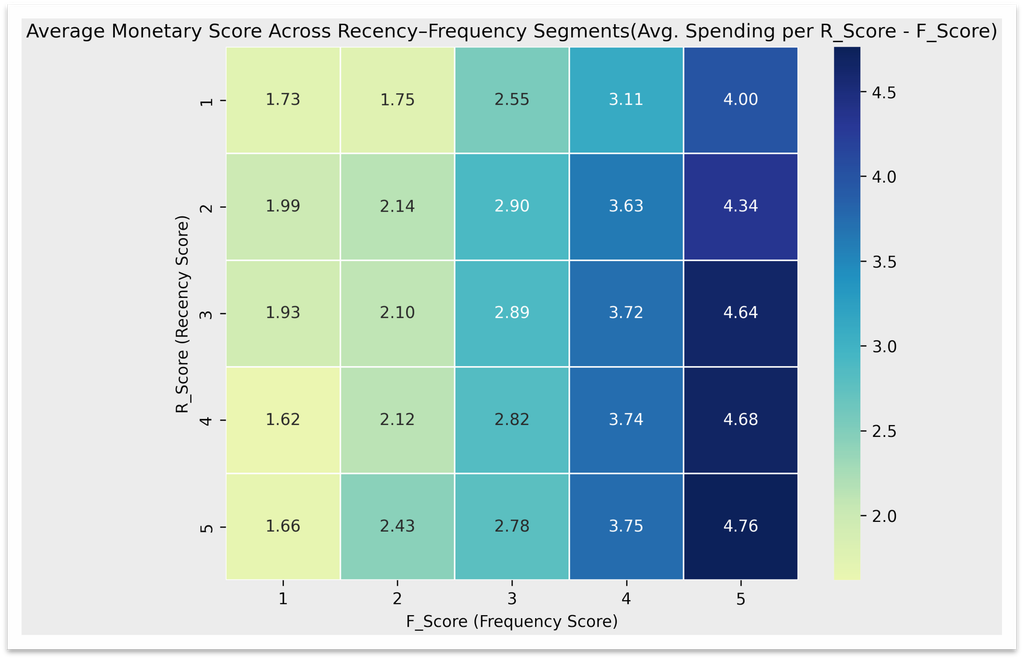
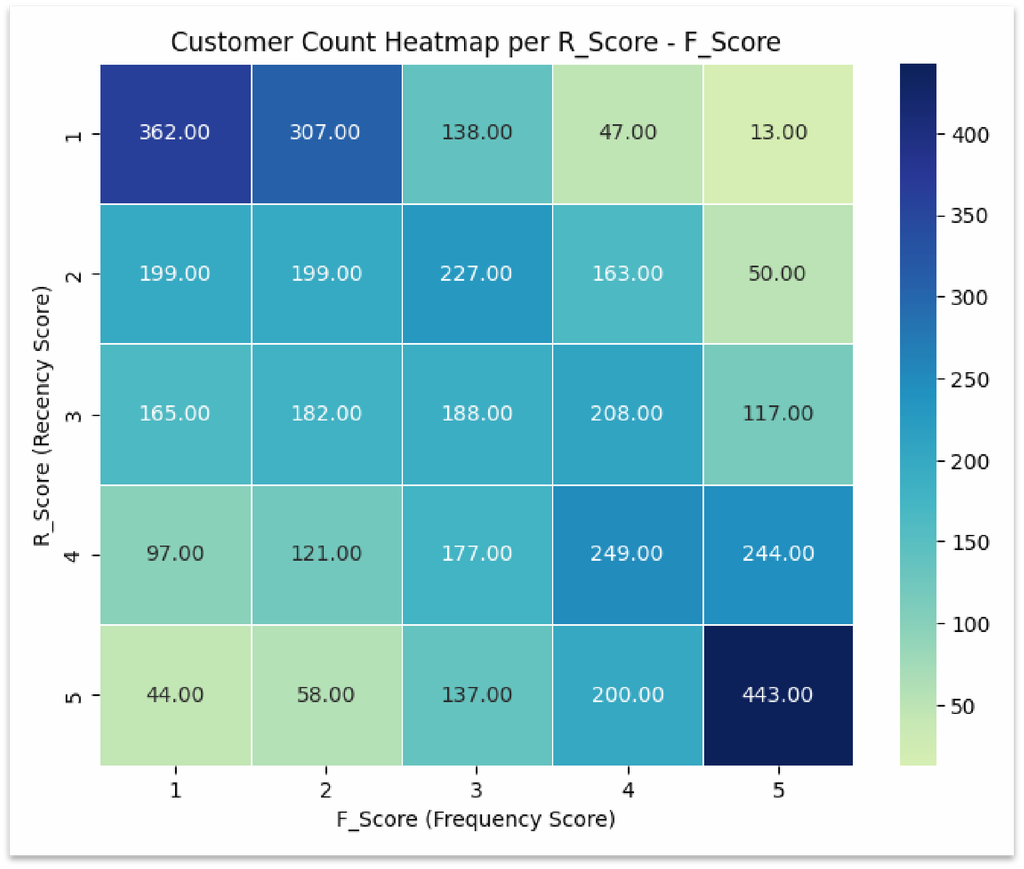
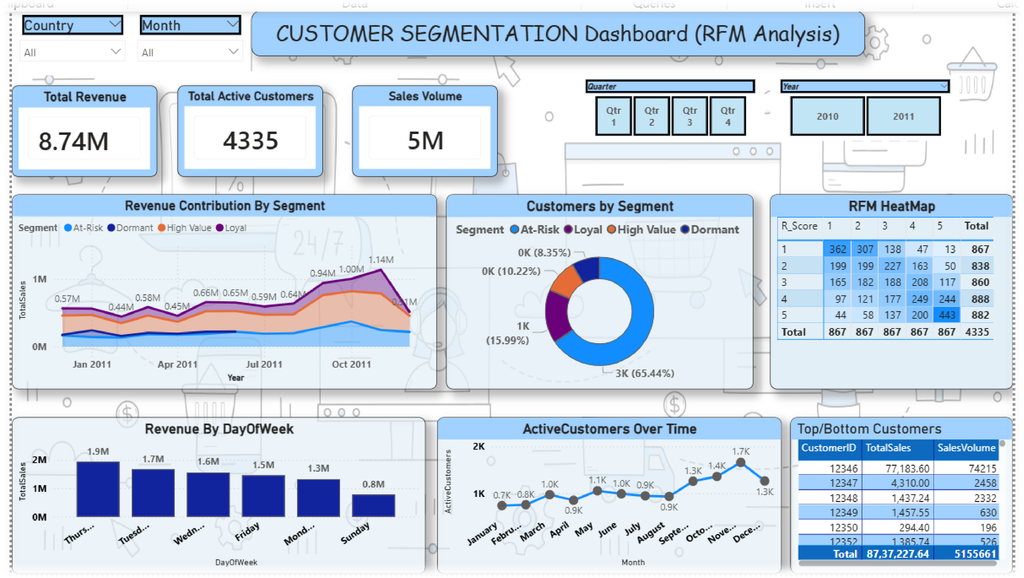
- 📊 Visualized using RFM heatmaps and dashboards.
Heat Map based on RFM Score :
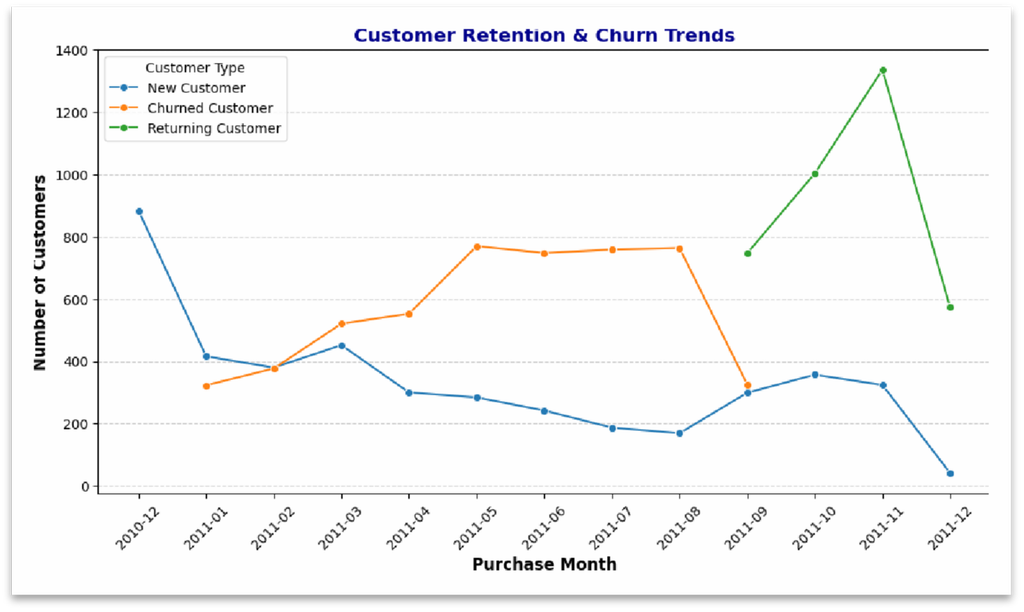
Customer-Level Churn Analysis :
- Churned Customer:
- A customer whose most recent purchase occurred more than 90 days ago.
- Methodology
- Calculated the last purchase date per customer
- Compared it with the latest date in the dataset
- Classified customers into:
- Active Customers
- Churned Customers
- Key Insight
- A significant portion of customers show extended inactivity, indicating churn risk.
- Churned customers largely overlap with low Frequency and low Monetary segments.
- (Business angle)
- Enables early churn detection
- Helps prioritize retention campaigns
- Reduces cost compared to acquiring new customers
Business Recommendations :
- Strategic Actions:
- 🎯 High-Value: Loyalty programs, exclusives
- 🔁 Loyal: Cross-sell & upsell campaigns
- ⚠️ At-Risk: Personalized offers, limited-time discounts
- ❌ Dormant: Win-back campaigns & feedback surveys
Simulated Impact of Targeted Marketing :
Before (No Segmentation)
- Generic campaigns sent to all customers
- Low engagement and conversion rates
- Higher marketing cost with poor ROI
After (RFM-Driven Strategy)
- Personalized campaigns by segment:
- High-Value → Loyalty rewards
- Loyal → Upsell & cross-sell
- At-Risk → Discounts & reminders
- Dormant → Win-back offers
- Simulated Outcome
- Improved engagement rates
- Increased repeat purchases
- Better marketing ROI
- Reduced churn probability
- Key Takeaway
- Targeted strategies outperform mass marketing by aligning offers with customer behavior.
VISUALIZATION IN POWER BI :
Tools & Technologies :
- Python: Pandas, NumPy
- Visualization: Matplotlib, Seaborn &
- Power Bi – Dashboarding
- Analysis: RFM segmentation, Pareto analysis
- Environment: Jupyter Notebook
Key Outcome :
Successfully transformed raw transactional data into actionable customer segments, enabling targeted marketing strategies, improved retention planning, and data-driven business decisions.